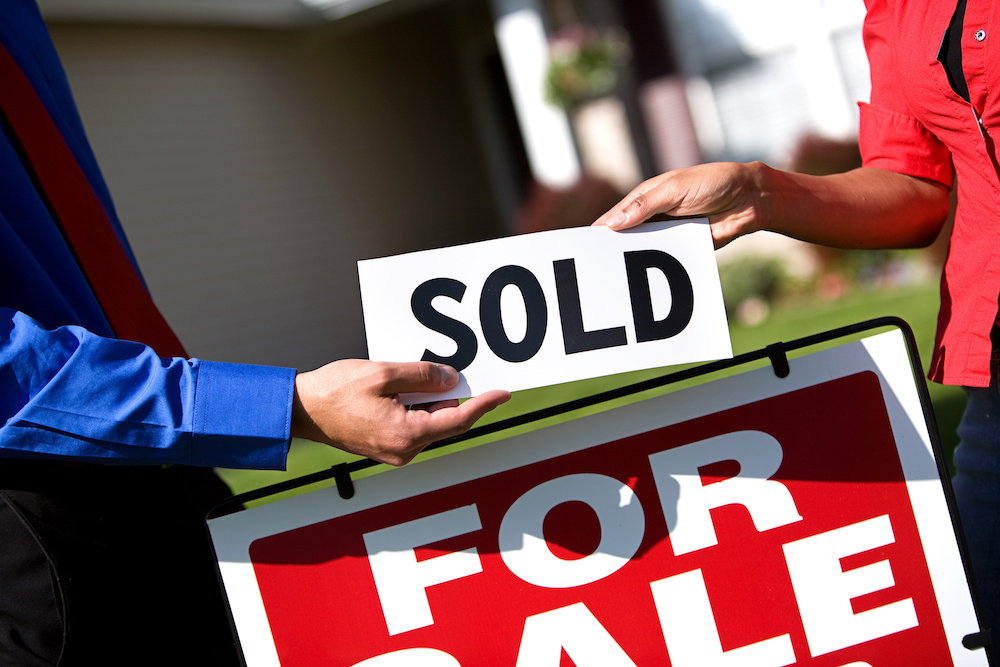
In February 2018, there were five homes sold, with a median sale price of $397,500. There were eight homes sold in Northfield in February 2017, and the median sales price for the period was also $397,500.
The median sales tax in Northfield for the most recent year with available data, 2017, was $9,781, approximately 2.5% of the median home sale price for February 2018.
The following table compares Northfield to other Cook County cities with similar median sales prices in February 2018:
| City | Feb. 2018 Home Sales | Feb. 2017 Home Sales | % change (Total Home Sales) | Feb. 2018 Median Sales Price | Feb. 2017 Median Sales Price | % change (Median Sales Price) |
|---|---|---|---|---|---|---|
| Wilmette | 20 | 22 | -9.1% | $545,750 | $426,250 | 28% |
| River Forest | 8 | 14 | -42.9% | $527,500 | $206,000 | 156.1% |
| Deercrest Estates | 2 | 1 | 100% | $510,000 | $370,000 | 37.8% |
| Park Ridge | 36 | 31 | 16.1% | $462,500 | $326,000 | 41.9% |
| La Grange Park | 8 | 6 | 33.3% | $412,500 | $451,000 | -8.5% |
| Northfield | 5 | 8 | -37.5% | $397,500 | $397,500 | 0% |
| Western Springs | 5 | 10 | -50% | $395,000 | $413,500 | -4.5% |
| Glenview | 27 | 42 | -35.7% | $385,500 | $415,750 | -7.3% |
| Palos Park | 8 | 5 | 60% | $383,500 | $400,000 | -4.1% |
| Rosemont | 1 | 2 | -50% | $370,000 | $390,000 | -5.1% |
| Northbrook | 19 | 33 | -42.4% | $359,000 | $457,000 | -21.4% |


 Alerts Sign-up