The CTA calculates ridership by counting the customers who board a transit vehicle (bus or rail).
The 69th-UPS Express route saw the largest increase in ridership with a 107.3 percent rise.
Bus and train traffic took a serious hit during the pandemic. The Metra, which provides service to many of Chicago's suburbs, saw a 97% decrease in ridership according to the Active Transportation Alliance. According to the Federal Transit Authority, Chicago's public transportation sector received $1.43 billion in bailout funds from the CARES act to combat the decrease in ridership.
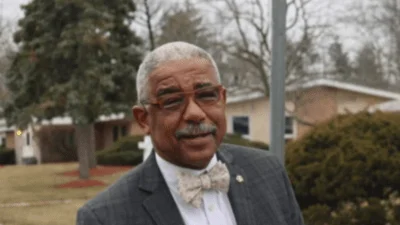
However, the CTA claimed ridership had rebounded 56 percent in the first six months of 2021. CTA's president Dorval R. Cart Jr. said weekday ridership has doubled since the initial shutdown.
| Rank | Route | Ridership increase from 2021 to 2022 (%) |
|---|---|---|
| 1 | 69th-UPS Express | 107.3 |
| 2 | Bronzeville/Union Station | 92.2 |
| 3 | Clarendon/LaSalle Express | 90 |
| 4 | U. of Chicago/Kenwood | 83.3 |
| 5 | U. of Chicago/Hyde Park | 66.8 |
| 6 | Sedgwick | 54.8 |
| 7 | Ogilvie/Streeterville Express | 53.4 |
| 8 | Stockton/LaSalle Express | 53.2 |
| 9 | Sheridan/LaSalle Express | 46.6 |
| 10 | Clarendon/Michigan Express | 45 |
| 11 | U. of Chicago Hospitals Express | 44.4 |
| 12 | Jeffery Manor Express | 42.3 |
| 13 | Streeterville/Taylor | 40.8 |
| 14 | LaSalle | 36.4 |
| 15 | South Shore Night Bus | 35.1 |
| 16 | Central/Ridge | 31.8 |
| 17 | Montrose | 31.5 |
| 18 | Pershing | 31.1 |
| 19 | Wallace-Racine | 29 |
| 19 | Inner Lake Shore/Michigan Expr | 29 |
| 21 | 55th/Narragansett | 26.6 |
| 22 | 59th/61st | 26.3 |
| 23 | California/Dodge | 26.2 |
| 24 | Harrison | 26.1 |
| 25 | Hyde Park Express | 25.1 |
| 26 | East 103rd | 25 |
| 27 | 31st | 24 |
| 27 | Archer/Harlem | 24 |
| 29 | Western Express | 22.8 |
| 30 | West 63rd | 22.7 |
| 31 | Outer DuSable Lake Shore Expr | 22.5 |
| 32 | Central | 21.8 |
| 33 | Ashland Express | 21 |
| 34 | South Damen | 19.8 |
| 35 | Devon | 18.9 |
| 36 | Blue Island/26th | 18.6 |
| 37 | North Central | 18.5 |
| 37 | Sheridan | 18.5 |
| 39 | Northwest Highway | 18.2 |
| 39 | Navy Pier | 18.2 |
| 41 | 51st | 17.7 |
| 41 | Harlem | 17.7 |
| 43 | Foster | 16.4 |
| 44 | West Lawrence | 16.1 |
| 45 | Damen | 15 |
| 45 | Archer | 15 |
| 47 | Lincoln | 14.4 |
| 48 | Kedzie | 13.9 |
| 49 | Wentworth | 13.4 |
| 50 | Jackson | 13.2 |
| 51 | Broadway | 13 |
| 51 | North Western | 13 |
| 51 | Stockton/Michigan Express | 13 |
| 54 | Austin | 12.4 |
| 55 | North Cicero/Skokie Blvd. | 12.2 |
| 55 | Lunt | 12.2 |
| 55 | West 65th | 12.2 |
| 58 | Narragansett/Ridgeland | 11.5 |
| 59 | Fullerton | 11.4 |
| 60 | Grand | 11.2 |
| 61 | Roosevelt | 11 |
| 61 | Peterson | 11 |
| 61 | 74th-75th | 11 |
| 61 | 87th | 11 |
| 65 | Diversey | 10.3 |
| 66 | Clark | 10.2 |
| 67 | South Halsted | 10.1 |
| 68 | Madison | 9.5 |
| 69 | Addison | 9.4 |
| 70 | South Cicero | 9 |
| 70 | Pullman/115th | 9 |
| 70 | Cermak | 9 |
| 70 | Laramie | 9 |
| 70 | Division | 9 |
| 70 | South Pulaski | 9 |
| 70 | Jeffery Jump | 9 |
| 70 | California | 9 |
| 70 | Skokie | 9 |
| 79 | Union/Streeterville Express | 8.4 |
| 80 | Western | 8.1 |
| 81 | Lawrence | 7.9 |
| 82 | South Kedzie | 7.8 |
| 82 | West 103rd | 7.8 |
| 84 | 111th/King Drive | 7.2 |
| 85 | Higgins | 7.1 |
| 86 | Pulaski | 6.7 |
| 87 | 31st/35th | 6.5 |
| 88 | King Drive | 6.2 |
| 89 | 47th | 6 |
| 89 | Water Tower Express | 6 |
| 89 | Cicero | 6 |
| 92 | Halsted | 5.3 |
| 93 | Chicago | 5.1 |
| 94 | Belmont | 4.9 |
| 95 | 67th-69th-71st | 4.3 |
| 96 | Vincennes/111th | 3.7 |
| 97 | Jeffery Local | 3.5 |
| 98 | North | 3.3 |
| 99 | Museum of S & I | 3.2 |
| 100 | 79th | 2.6 |
| 101 | 16th/18th | 2.4 |
| 102 | Milwaukee | 1.6 |
| 103 | Irving Park | 1.4 |
| 104 | South Michigan | 0.7 |
| 104 | Armitage | 0.7 |
| 106 | South Shore Express | 0.4 |
| 107 | Kimball-Homan | 0.1 |


 Alerts Sign-up